How to Organize Qualitative Research: A Step-by-Step Guide
Have you been struggling to dig out research that’s buried in long emails or Slack threads?
Not only can this be a time suck, but it can make all your hard-won data inaccessible, therefore, useless. As Tracy Teal, executive director of The Carpentries that teaches coding and data skills to researchers globally, points out , “your data are not useful unless people — and ‘future you’ — know what they are.”
The solution? Organizing qualitative data.

Sure, this sounds like a big commitment at first thought. But, it always pays off in the future.
So, in this post, we’ll cover:
- A recap of what qualitative data is
- All the work you need to do to organize qualitative data
- How Aurelius can help reduce the manual work involved
Let's get to it.
What is qualitative data?
Qualitative data is long-form data gathered using sources like user interviews (written or recorded), survey responses, questionnaires, and observational notes.
Unlike quantitative data, this data type provides in-depth insights into the respondents’ minds that reveal their emotional responses.
However, as valuable as this data is, its usefulness and all your hard work can easily go down the drain if you don’t take qualitative data management into account.
How do you organize qualitative data?
Before we dig in, it’s important to mention here that we’re proponents of organizing data before you start researching. Or, at least, as you research.
This comes with numerous benefits including:
- It speeds up user research data analysis . Since you’ve everything organized, you’re less likely to hit roadBlocks as you analyze data.
- Makes it easy to find and reuse data in the future . Naturally, this reduces work on your plate, boosting productivity and helping you make data-informed decisions.
- Easier (and faster) to apply all the takeaways from your research insights . You build up institutional knowledge and a better understanding of your product space and target audience over time.
With that, let’s get to the meaty part: steps in organizing qualitative data.
1. Start with a plan
Taking a planning-first approach sets you up for consistency in organizing qualitative data.
Two important things you should be addressing here:
Identify if you should be organizing qualitative data by project or product
Either pattern or a combination of the two are correct:
- Organizing by project. Example: user interviews for website UX – 2020
- Organizing by product or feature. Example: usability tests for leaving comments feature – 2020
But, the right way is the one that suits your team and those who will be accessing research data in the future.
So it’s helpful to involve key team members to get their thoughts on the organization pattern. Or, if your team has already been organizing research data using either pattern, stick to it
Agree on who will be incharge of all the data organizational work
You know what they say about too many cooks spoiling the broth. Sure, everyone on the UX research team can make notes and should have access to the data library (we’ll talk about this in a bit).
But having a dedicated person for housekeeping is an effective way to ensure all data is filed and organized according to the defined ground rules.
2. Settle on the organization tool you’ll use
A research organization tool is where you’ll be hosting and managing all the data. It’s here that you and your team will be taking notes too.
Keep in mind that memo writing or note-taking are essential in the research process. You record your thoughts, observations, and any follow-up questions. By doing so, you can easily pick up research from where you leave it. Not to mention, note-taking helps with qualitative data analysis too.
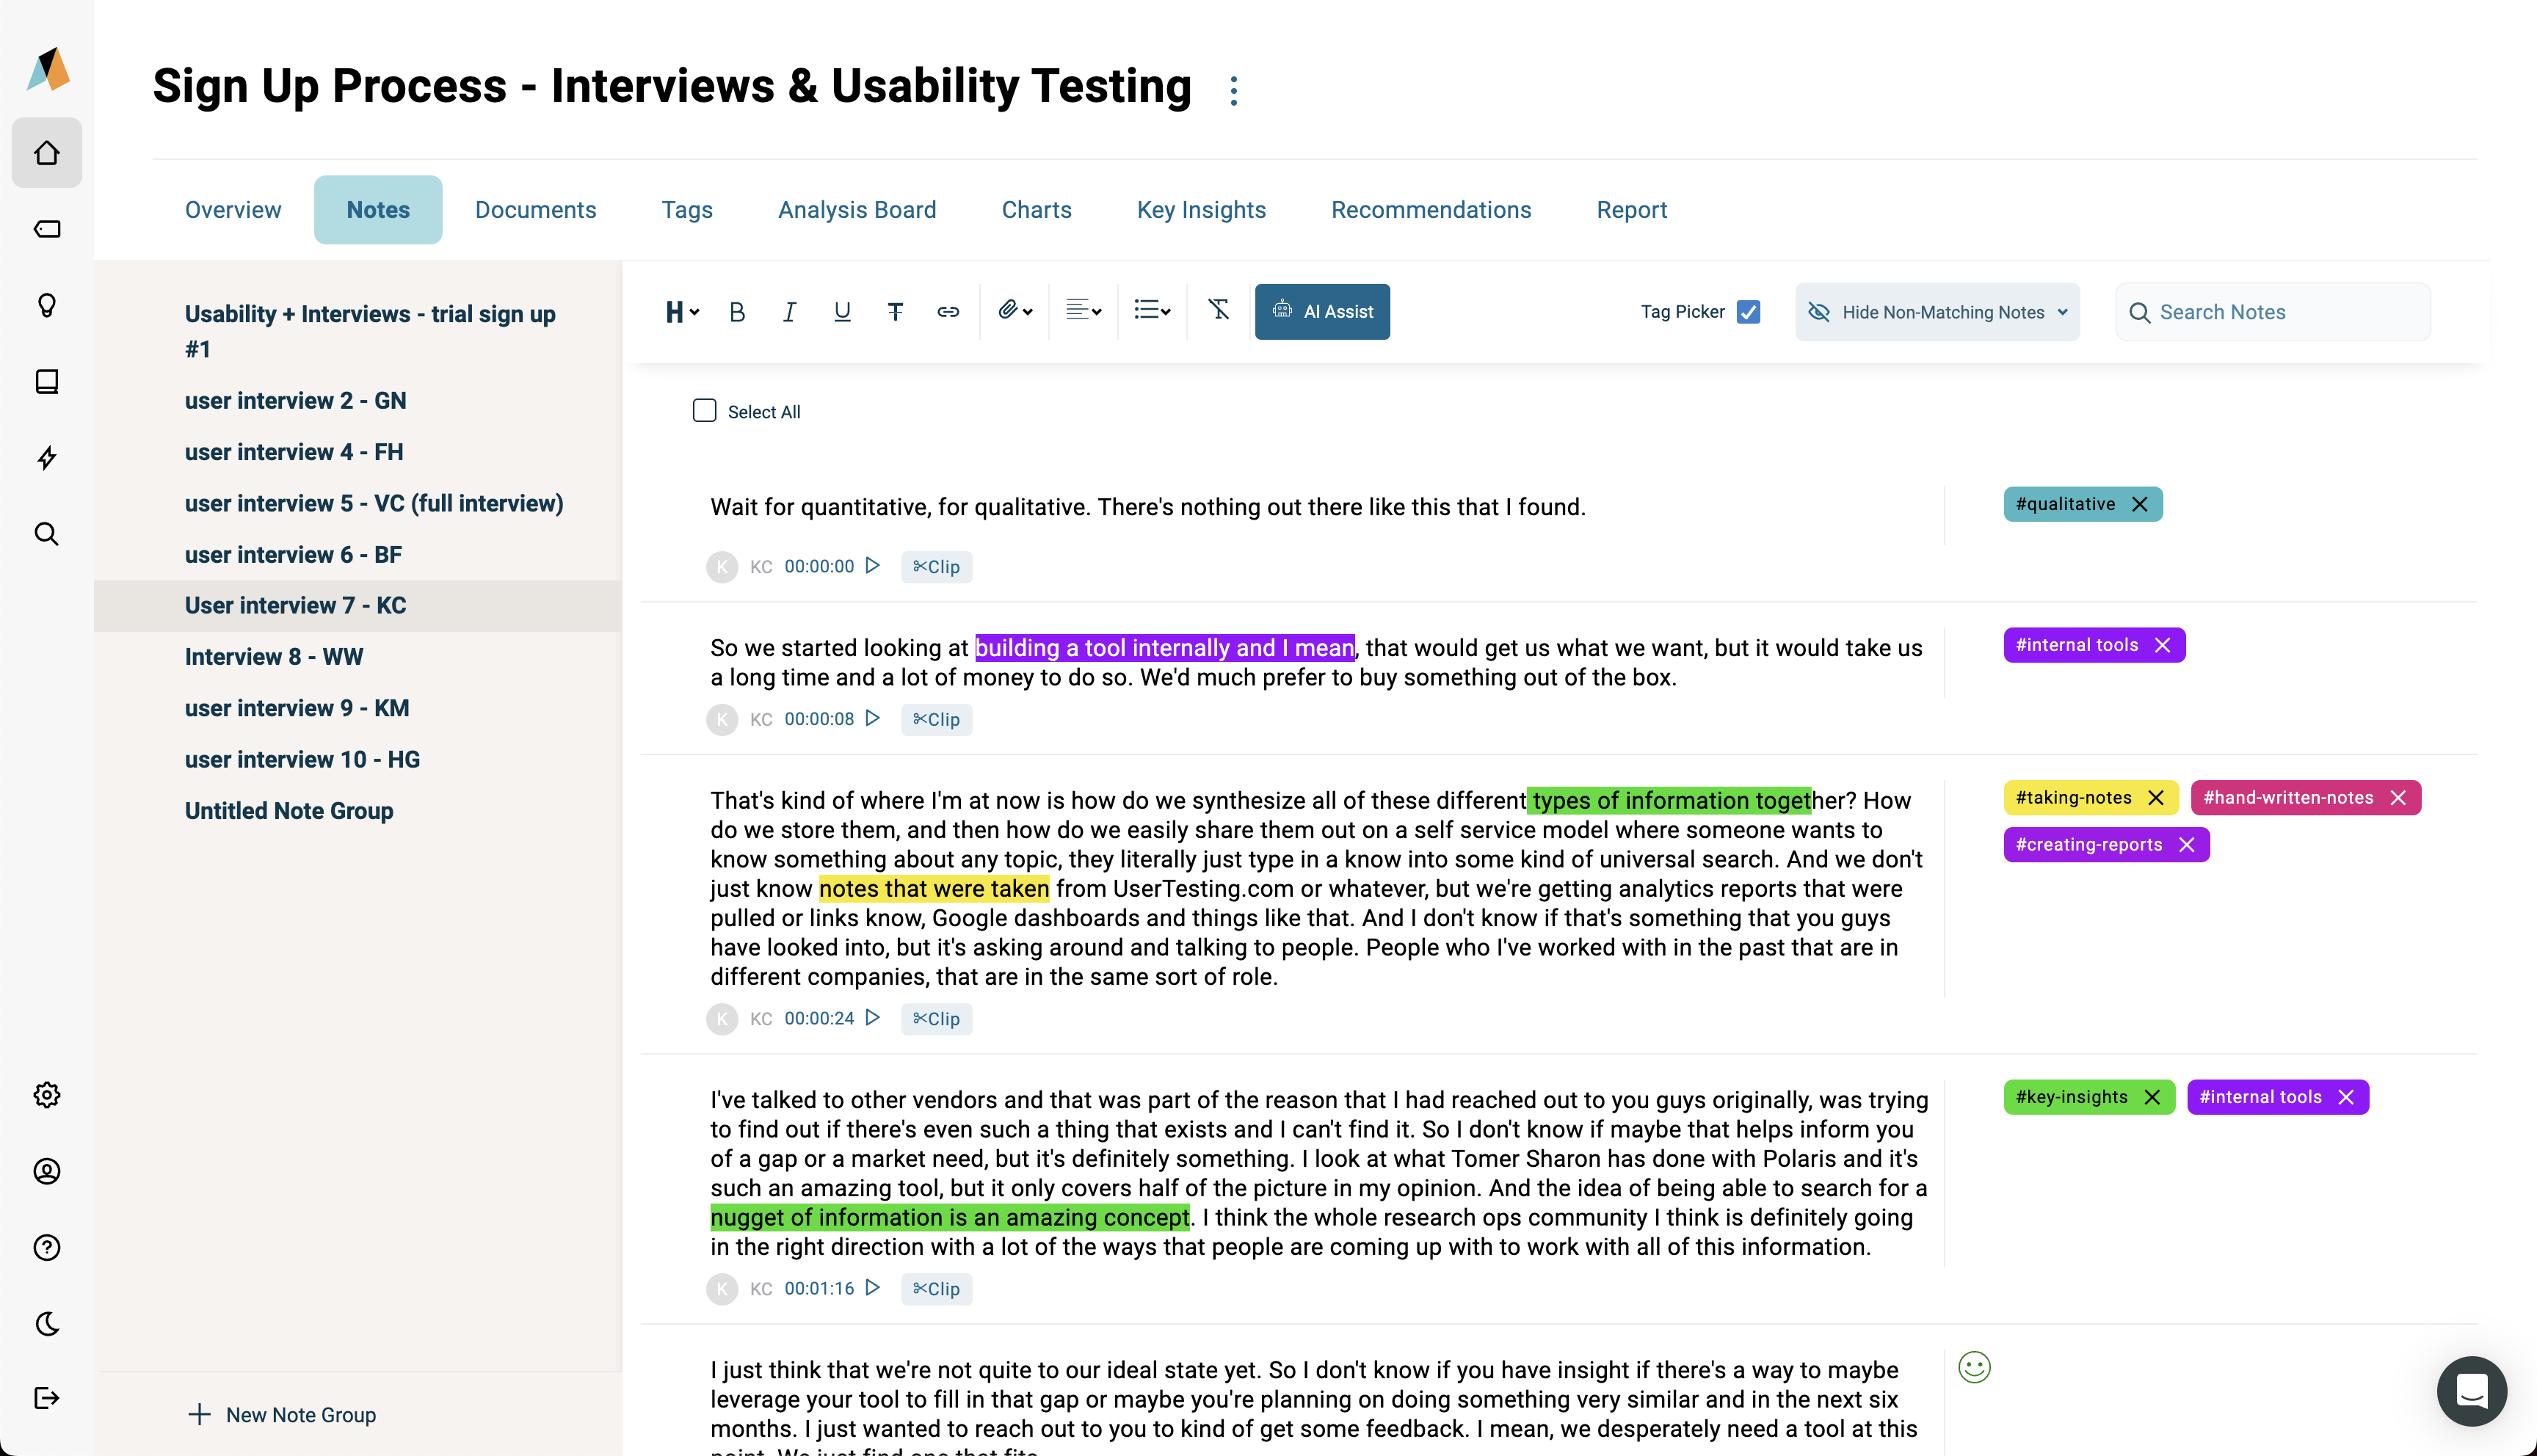
So there are three types of notes you and your team will be making throughout the research process:
- Observational notes: Notes on researcher’s observation based on what they see and listen.
- Theoretical notes: Notes compiling researcher’s controlled thoughts on analyzing what they observe (data interpretation notes).
- Methodological notes: Notes recording reminders for the research process including a critique on researcher’s tactics and method-related pointers such as sequencing, timing, stage setting, and so on.
Tip: You can add in-process memos as well. These address methodological questions like what to observe next and follow-up question(s) to ask – helping focus and guide future analysis and observation.
With your team aware of the different notes they are taking, agree on how to name each type of note.
For example, if a researcher on the team makes observational notes, they should add a previously agreed upon tag or name such as an abbreviation ‘ON’ for the note type. This saves notes from becoming unorganized personal monologues.
And, to ensure notes are all accessible, work out the organizational tool that’ll house them. A note-taking app, spreadsheet, and a research organization tool like Aurelius can help.
The latter, of course, comes with more benefits than a synced and shared note document or spreadsheet.
A dedicated tool, for example, reduces manual work involved in organizing data while helping create an accessible central research repository.
Want to shift all your current data from various spreadsheets and other random text files? Aurelius makes it easy for you with the following options:
- Upload data from a spreadsheet
- Upload audio files and the software transcribes it for you
- Copy and paste from any text file like Google Docs or Microsoft Word
- Use Zapier integrations to pull data from other tools like SurveyMonkey, Google Forms, Qualtrics, etc.
- Magic upload
Tip: Add tags to your notes so they’re easily findable. In fact, with tags in place, you can search your entire user research project by a tag to see all notes with that tag. Just make sure you create a parent note explaining how you’re adding tags.
3. Define a consistent file naming system
In the previous step, we’ve suggested you develop a consistent note naming system. Let’s expand on it further.
If everyone names research files with whatever name they think suits it best, it’ll quickly become challenging to keep track of all the files. This is where a file naming system comes into the picture.
Ideally, it’s best to settle on the document naming process at the start of a research project. A logical and consistent file naming system will help you and others locate research easily. It’ll also simplify organizing future research correctly.
So how do you create a file naming system?
As you settle on the way to name your files, make sure the system you devise is:
- Consistent
- Meaningful to you and your colleagues
- Makes it easy for everyone to find files
To this end, agree on the following file naming elements: vocabulary, dates, punctuation, order, and numbers. It’s best you create a name around these attributes:
- Data collection date
- Data collection method
- Participant ID number
- Site of data collection
Avoid using special characters such as dots and / \ : * ? " < > as they can make it difficult to maintain consistency.
4. Record key insights or UX nuggets
With choosing an accessible organization tool and settling on a file naming system out of the way, let’s get you to analyze data as you research.
While creating detailed reports is one way to record your findings, there’s a better, much more digestible way too: creating UX nuggets . Unlike research reports that are tedious to read, UX nuggets are easy to share, understand, and revisit.
Essentially, UX nuggets are key insights or findings, communicating what you’ve learned from your research – packaged as one snackable, therefore, reusable, insight at a time. This, in turn, helps you get more mileage from past research.
Basically, key insights capture answers to questions you ask as you research a topic, product, or feature.
To create your own consistent UX nuggets, address these four areas:
- Key insight statement - Example: Design team is looking to find out how they can improve the blog’s readability.
- Key insight description - Example: We learned adding more whitespace can help improve the blog’s readability.
- Supporting notes and/or documents - Add any specific notes or support material like videos, interviews, and so on.
- Tags - Example: #site-usability #readability
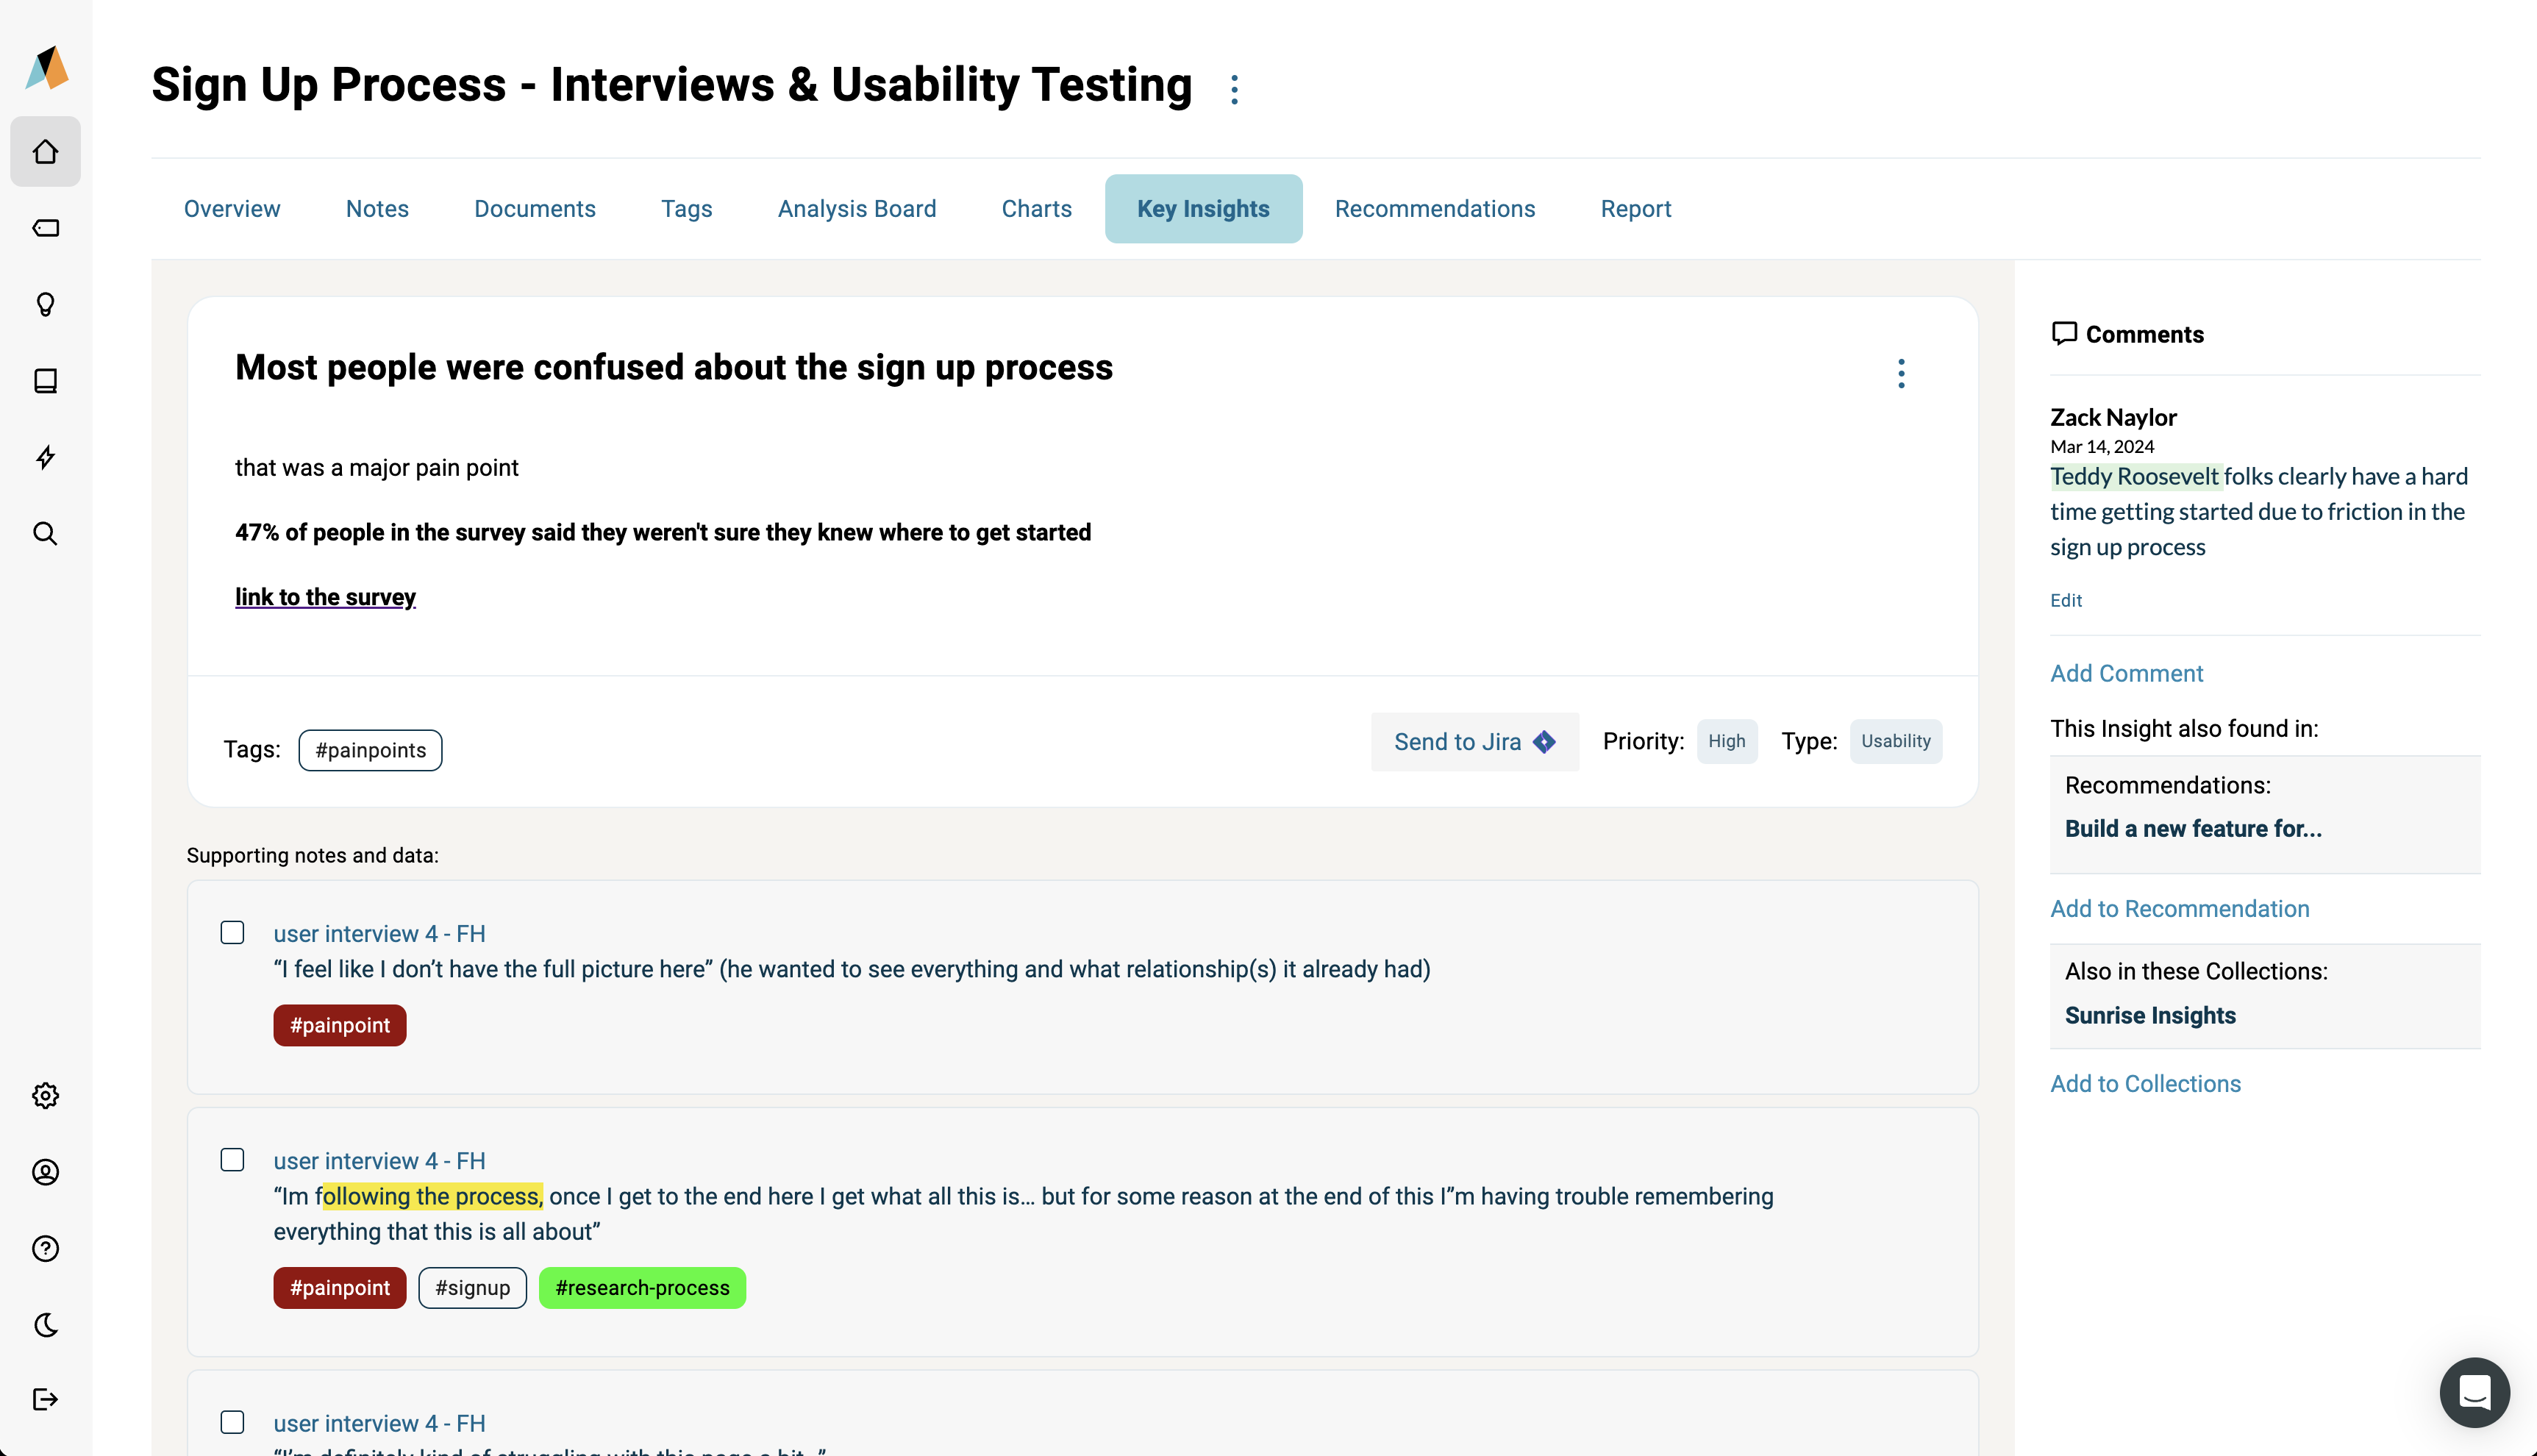
Tip: Add tags to key insights in Aurelius to make them easily searchable.
5. Organize data into themes and categories
Now, start combining notes, key insights, and data files sharing a common theme into broad categories.
Use folders or Group Tag in Aurelius to group these files so all information on a particular theme, topic, or category is located in one folder or under one broad tag.
If you’re manually creating folders, keep the following pointers in mind as you organize them:
- Name folders appropriately
- Structure folders hierarchically
- Separate ongoing and completed work
If you’re using Aurelius, you only need to add tags. For this, add all similar-themed tags (those you’ve added to your notes, UX nuggets, and other files) into a Tag Group.
6. Create a code library
Now is the part where you create notes on how you’ve been tagging different research insights. In other words: explain how you’re labeling each tag, Tag Group/folder to correspond to a particular category.
Technically, this process is known as coding, which Kathy Charmaz defines in their book , Constructing grounded theory: A practical guide through qualitative analysis , as
“Coding means naming segments of data with a label that simultaneously categorizes, summarizes, and accounts for each piece of data. Coding is the first step in moving beyond concrete statements in the data to making analytic interpretations.”
Therefore, a simple action step: pull out a new note in Aurelius and create a table of contents-like code dictionary or code table that enlists which Tag Groups contain which research. This way, you can organize folders properly.
If you prefer, add depth to this library by writing instructions explaining the criteria to include or exclude data under a tag or Tag Group. Pair each criterion with a data excerpt to show how the filing criterion has been applied (and can be in the future).
However, none of this would be possible if you haven’t mapped out buyer personas to guide recruitment.
7. Create a data inventory
If there’s a lot of research that your company creates, you’ll find it useful to create a data inventory. It’s a library of the code tables for different research projects you’ve conducted.
Since the data inventory provides a full record of all the accessible data a company owns, you need to include all the essential topical information to complete it.
Add the following elements:
- Researcher(s)
- Study description including researching purpose and research questions.
- Study method including information on participants (how many recruited and how – covering criteria for sampling as well).
- Information on study methods used (focus group, in-person or online interviews, and so on).
- Study duration answering when the study was conducted and how long it took.
- Data description offering details on the data such as how much data you have. This can be further divided into video or interview transcripts, research context, and appendices including any chart with a summary of data and data sample.
8. Share your research
“Research that isn’t shared is research that hasn’t been done,” observes Lindsey Redinger, InVision’s Manager of User Research and Operations on our podcast.
With that in mind, let’s dig into how to share your research as the last step in organizing qualitative data.
Traditionally, research reports and presentation decks have been used as the go-to way to share research. But those can not only be tedious to create but also to read.
A good solution then is sharing key insights in Collections.
Each research often answers questions that are of no value at that time. But they can be useful later on.
This is why all this work that you put into capturing, organizing, and managing your research work is helpful, serving as a vitamin in the long haul. It’s also what makes it easy to reshare new information from past studies.
So the best way to share research is by sharing high-level points or key insights from your research log over email.
To begin with, search through your tags to find relevant UX nuggets. Do so whenever:
- Someone on your team or another department asks if you’ve research on X topic or
- When you’re making a case for or against a point and want to back it up with research
Then, put them in a Collection, a shareable custom group of research data and insights. You can also attach a tag or two to share the raw data and notes that back the key findings.
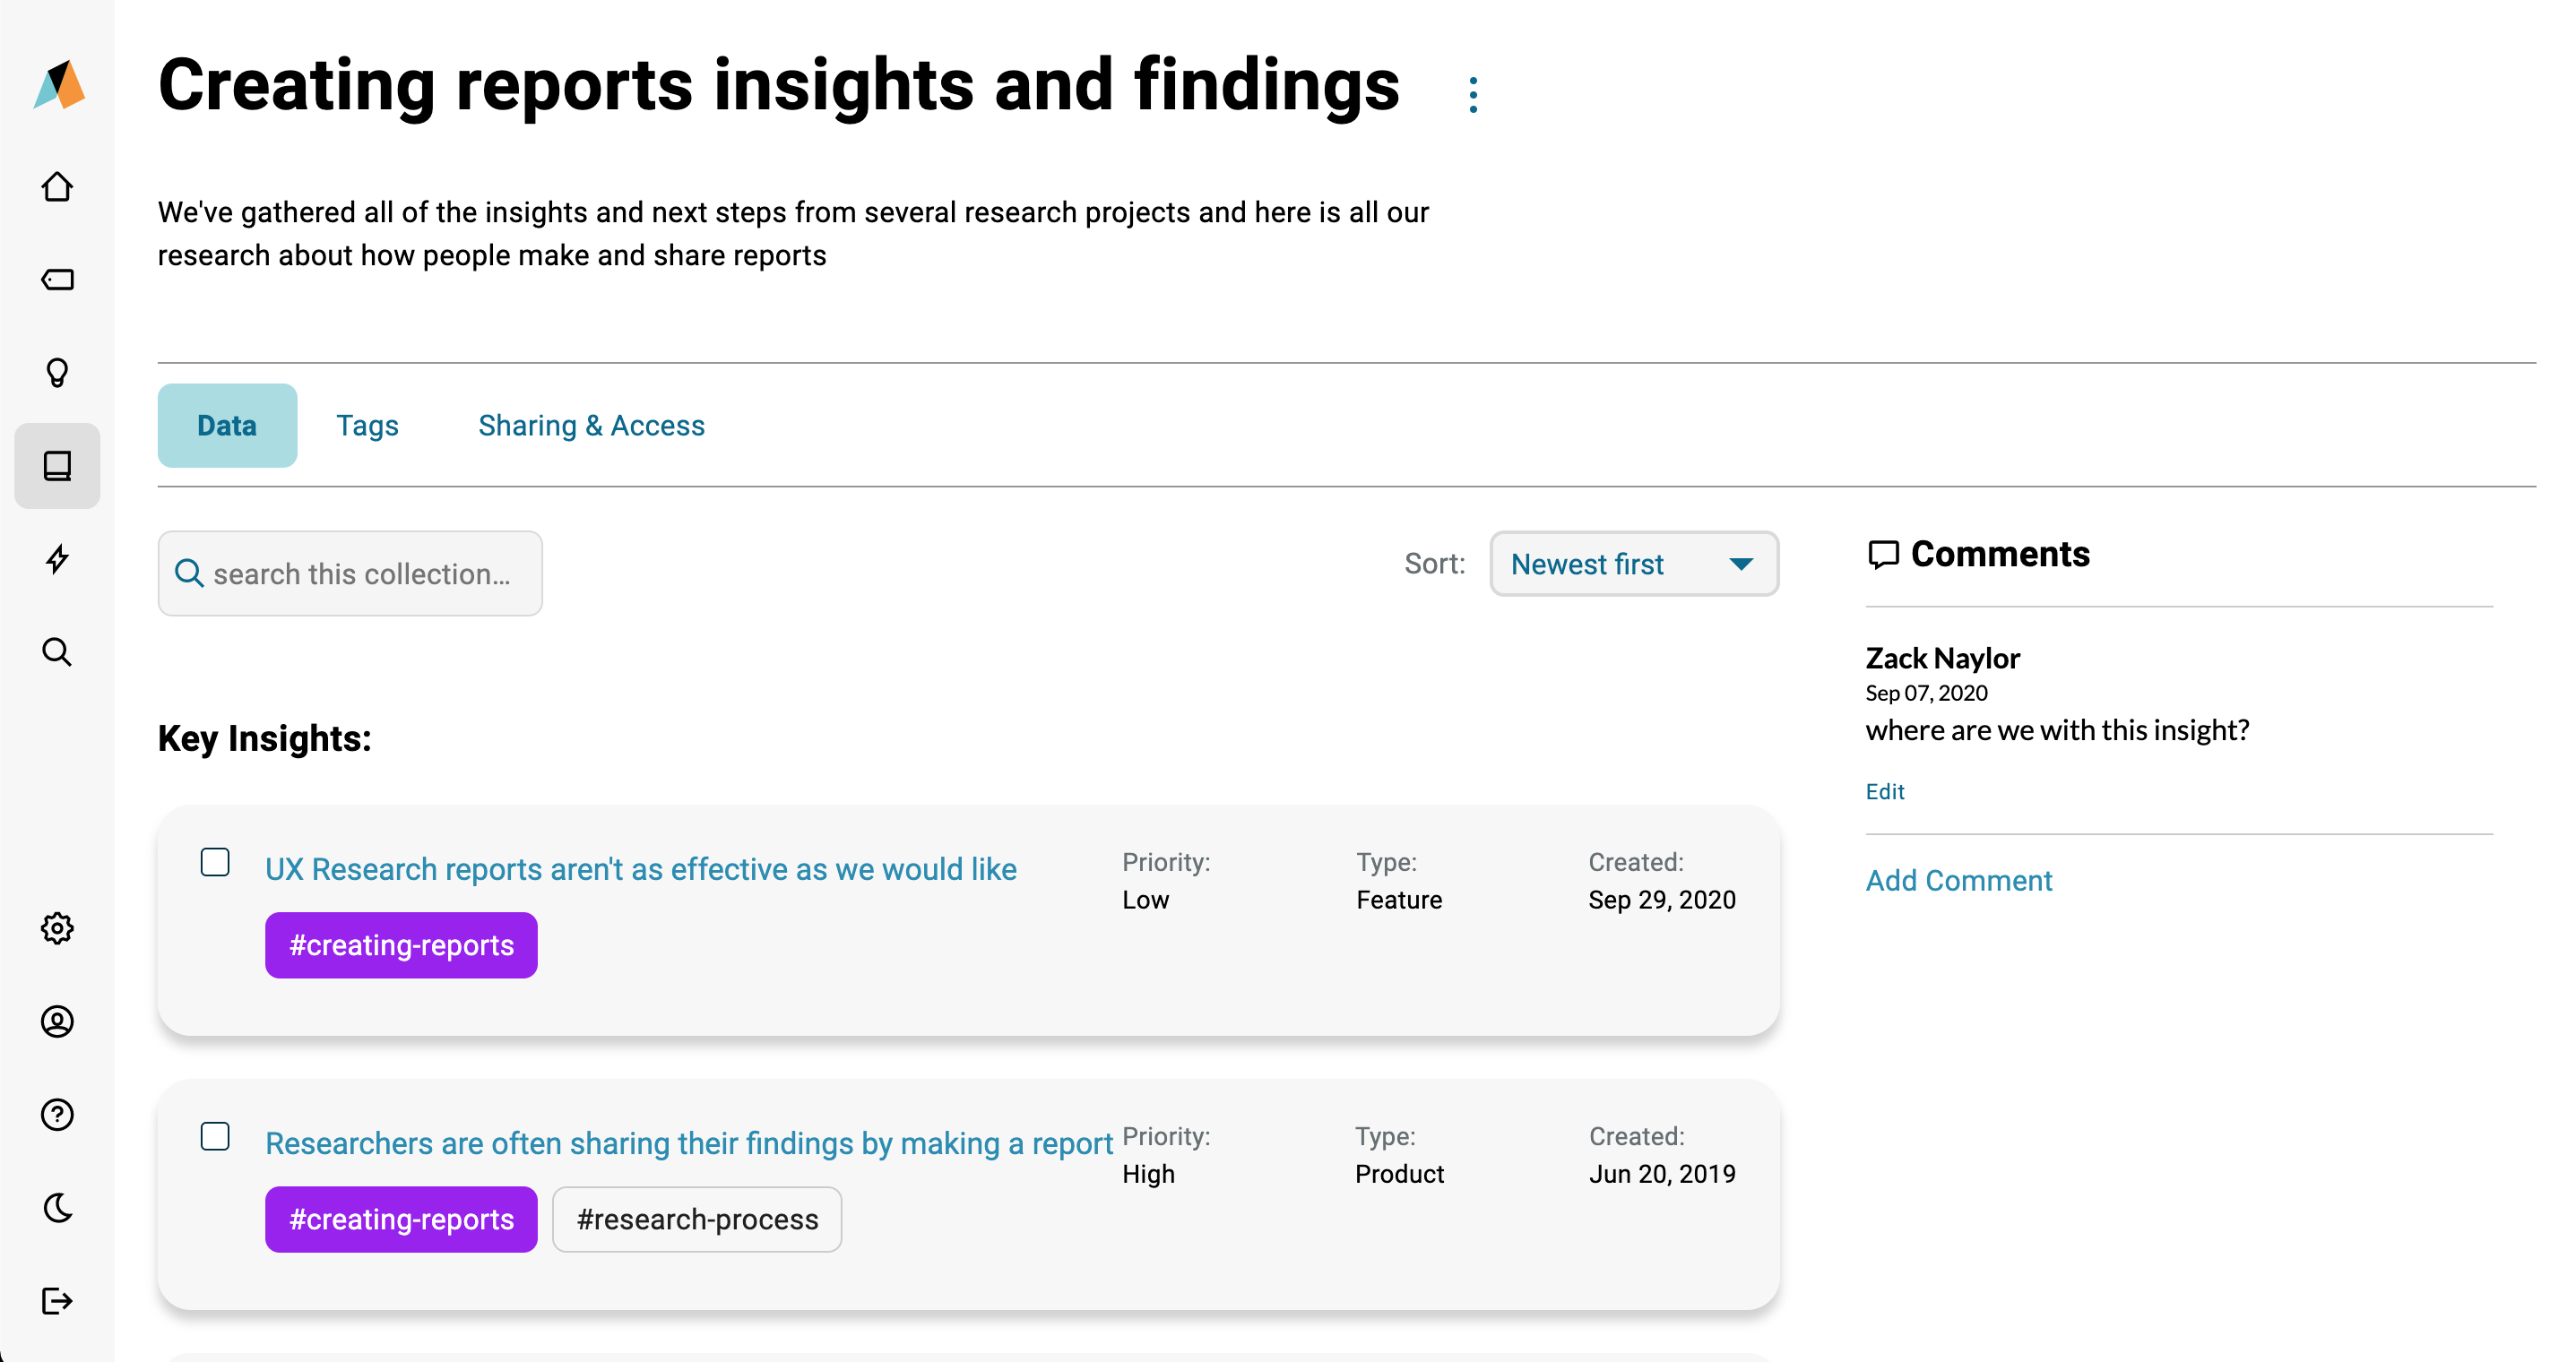
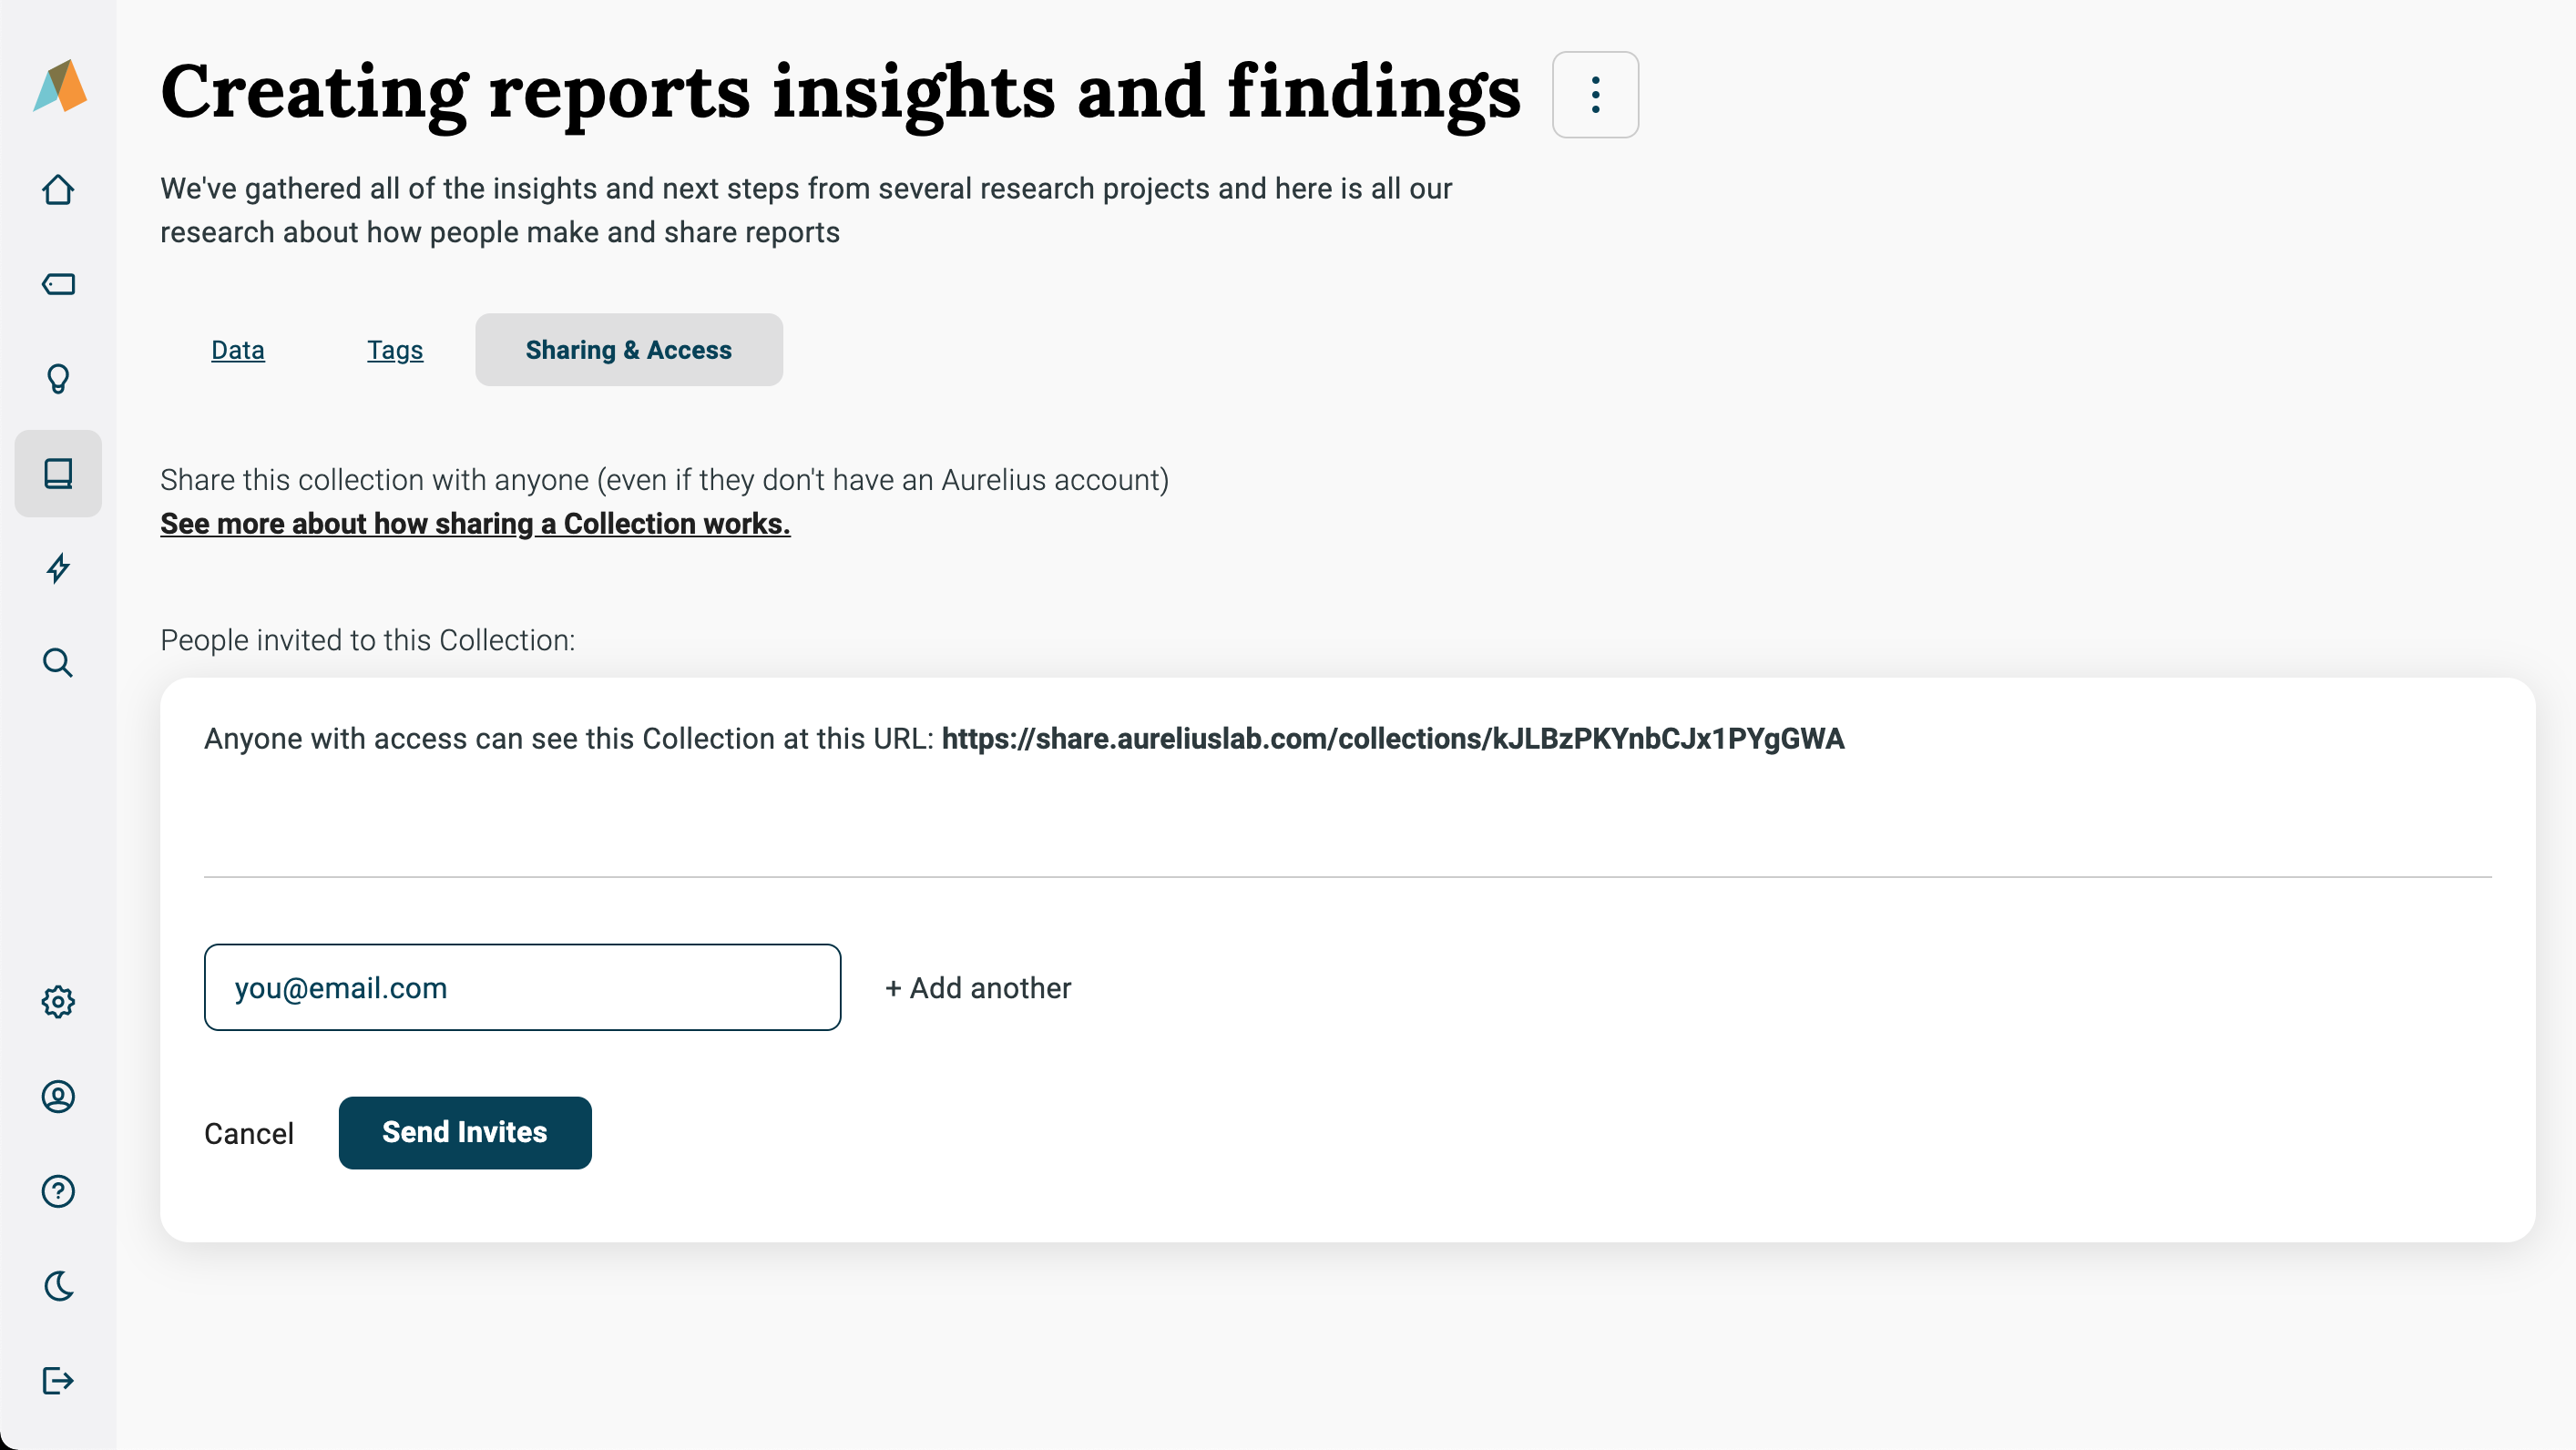
From there, share the Collection by either adding the person’s email address or emailing them a link containing the read-only version.
If needed, schedule a follow-up call. At Aurelius, we’ve found this to be the most effective approach to sharing and revisiting research insights.
Tying it all together
See? Organizing qualitative research wasn’t so hard, was it?
To recap, start organizing qualitative data before you start researching. Then follow through this checklist for steps in organizing qualitative data:
- Agree on a qualitative data organization pattern (project-, feature-, or product-based) and a tool to host all your data, files, and notes.
- Create a consistent file naming system and start tagging notes.
- Create and tag UX nuggets or key insights to analyze data as you go.
- Put all tagged files, UX nuggets, sharing a topic, theme, or any other criteria you select into folders or Tag Groups.
- Create a code table to explain how you’ve tagged and grouped tagged files to set the foundation for future tags.
- Build a data inventory for developing a research repository as your research projects grow.
- Share key insights from current and past research projects using Collections and email them to even those who don’t have an Aurelius account.